# Let's load in the survey data...
%matplotlibinlinefrompprintimportpprintimportpandasaspdimportseabornassnsimportmatplotlib.pyplotaspltimporttextwrapimportredf2019=(pd.read_csv("data/2019-user-survey-results.csv.gz",parse_dates=["Timestamp"]).replace({"How often do you use Dask?":"I use Dask all the time, even when I sleep"},"Every day"))df2020=(pd.read_csv("data/2020-user-survey-results.csv.gz").assign(Timestamp=lambdadf:pd.to_datetime(df['Timestamp'],format="%Y/%m/%d %H:%M:%S %p %Z").astype('datetime64[ns]')).replace({"How often do you use Dask?":"I use Dask all the time, even when I sleep"},"Every day"))df2021=(pd.read_csv("data/2021-user-survey-results.csv.gz").assign(Timestamp=lambdadf:pd.to_datetime(df['Timestamp']).astype('datetime64[ns]')).replace({"How often do you use Dask?":"I use Dask all the time, even when I sleep"},"Every day"))common=df2019.columns.intersection(df2020.columns).intersection(df2021.columns)added=df2021.columns.difference(df2020.columns)dropped=df2020.columns.difference(df2021.columns)df=pd.concat([df2019,df2020,df2021])df['Year']=df.Timestamp.dt.yeardf=df.set_index(['Year','Timestamp']).sort_index()
q="How often do you use Dask?"ax=sns.countplot(y=q,data=df2021[q].dropna().str.split(";").explode().to_frame());ax.set(ylabel="",title=q);
q="How long have you used Dask?"# New question in 2021
order=["More than 3 years","1 - 3 years","3 months - 1 year","Less than 3 months","I've never used Dask"]ax=sns.countplot(y=q,data=df2021[q].dropna().str.split(";").explode().to_frame(),order=order);ax.set(ylabel="",title=q);
略多于一半的受访者与其他人(他们的团队或组织)一起使用Dask,另一半则独自使用Dask。
q="Do you use Dask as part of a larger group?"order=['I use Dask mostly on my own','My team or research group also use Dask','Beyond my group, many people throughout my institution use Dask',]ax=sns.countplot(y=q,data=df2021[q].dropna().str.split(";").explode().to_frame(),order=order)ax.set(ylabel="",title=q);
q="What industry do you work in?"# New question in 2021
data=df2021[q].dropna().str.split(";").explode().to_frame()order=data.value_counts()[data.value_counts()>1].keys().get_level_values(0)ax=sns.countplot(y=q,data=data,order=order);ax.set(ylabel="",title=q);
您升级到较新版本的Python库有多容易?
大多数用户在需要时可以轻松升级到较新版本的Python库。
q="How easy is it for you to upgrade to newer versions of Python libraries"sns.countplot(y=q,data=df2021[q].dropna().explode().to_frame()).set_ylabel('Scale from 1 (Difficult) to 4 (Easy)');
q="What are some other libraries that you often use with Dask?"data=df2021[q].dropna().str.lower().str.split(", ").explode().to_frame()labels=pd.value_counts(data[q]).iloc[:10].indexsns.countplot(y=q,data=data,order=labels).set_ylabel('');
q='Interactive or Batch?'data=df2021[q].dropna()data=data.str.replace('Interactive: I use Dask with Jupyter or IPython when playing with data, Batch: I submit scripts that run in the future',"Interactive and Batch")data=data.str.replace('Interactive: I use Dask with Jupyter or IPython when playing with data',"Interactive")data=data.str.replace('Batch: I submit scripts that run in the future',"Batch")order=["Interactive and Batch","Interactive","Batch"]sns.countplot(y=q,data=data.explode().to_frame(),order=order).set_ylabel('');
q="How do you view Dask's dashboard?"ax=sns.countplot(y=q,data=df2021[q].dropna().str.split(", ").explode().to_frame());ax.set(ylabel="",title=q);
本地机器还是集群?
大约三分之二的受访者至少部分时间使用计算集群。
q='Local machine or Cluster?'df[q].dropna().str.contains("Cluster").astype(int).groupby("Year").mean()
Year
2019    0.654902
2020    0.666667
2021    0.630081
Name: Local machine or Cluster?, dtype: float64
q='Local machine or Cluster?'order=['Personal laptop','Large workstation','Cluster of 2-10 machines','Cluster with 10-100 machines','Cluster with 100+ machines']ax=sns.countplot(y=q,data=df2021[q].dropna().str.split(", ").explode().to_frame(),order=order);ax.set(ylabel="",title=q);
如果您使用集群,如何启动Dask?
SSH是在计算集群上启动Dask最常用的方式,其次是HPC资源管理器,然后是Kubernetes。
q="If you use a cluster, how do you launch Dask? "data=df2021[q].dropna()data=data.str.replace("HPC resource manager (SLURM, PBS, SGE, LSF or similar)","HPC resource manager (SLURM PBS SGE LSF or similar)",regex=False)data=data.str.replace("I don't know, someone else does this for me","I don't know someone else does this for me",regex=False)data=data.str.split(", ").explode().to_frame()order=data.value_counts()[data.value_counts()>1].keys().get_level_values(0)ax=sns.countplot(y=q,data=data,order=order);ax.set(ylabel="",title=q);
q="If you use a cluster, do you have a need for multiple worker / machine types (e.g. GPU / no GPU, low / high memory) in the same cluster?"# New question in 2021
ax=sns.countplot(y=q,data=df2021[q].dropna().str.split(";").explode().to_frame());ax.set(ylabel="",title="Do you need multiple worker/machine types on a cluster?");
数据集
您的数据集通常有多大?
Dask用户最常处理千兆字节大小的数据集。很少有用户处理拍字节大小的数据集。
q="How large are your datasets typically?"# New question in 2021
ax=sns.countplot(y=q,data=df2021[q].dropna().str.split(", ").explode().to_frame());ax.set(ylabel="",title=q);
您的数据集通常存储在哪里?
大多数人将数据存储在本地文件系统上。
q="Where are your datasets typically stored?"# New question in 2021
data=df2021[q].dropna().str.split(", ").explode().to_frame()order=data.value_counts()[data.value_counts()>1].keys().get_level_values(0)ax=sns.countplot(y=q,data=data,order=order);ax.set(ylabel="",title=q);
q="What file formats do you typically work with?"# New question in 2021
data=df2021[q].dropna().str.split(", ").explode().to_frame()order=data.value_counts()[data.value_counts()>1].keys().get_level_values(0)ax=sns.countplot(y=q,data=data,order=order);ax.set(ylabel="",title=q);
['proprietary measurement format',
 'netCDF3',
 'czi',
 'specifically NetCDF4',
 'grib2',
 'in-house npy-like array format',
 'jpeg2000',
 'netCDF4 (based on HDF5)',
 'proprietary microscopy file types. Often I convert to Zarr with a loss of metadata.',
 'sas7bdat',
 'npy',
 'npy and pickle',
 'root with uproot',
 'root',
 'regular GeoTiff',
 '.npy',
 'Text',
 'VCF BAM CRAM',
 'UM',
 'CASA measurement sets',
 'Casa Tables (Radio Astronomy specific)',
 'Custom binary',
 'FITS',
 'FITS (astronomical images)',
 'FITS and a custom semi-relational table specification that I want to kill and replace with something better',
 'Feather (Arrow)',
 'GPKG',
 'GeoTIFF',
 'NetCDF4',
 'Netcdf',
 'Netcdf4',
 'PP',
 'SQL',
 'SQL query to remote DB',
 'SQL to Dataframe',
 'Seismic data (miniSEED)',
 'TFRecords',
 'TIFF',
 'Testing with all file formats. Just want it as a replacement for spark. ',
 '.raw image files',
 'ugh']
q="Do you use Dask projects to deploy?"order=["dask-jobqueue","dask's helm chart","dask-kubernetes","dask's docker image at daskdev/dask","dask-gateway","dask-ssh","dask-cloudprovider","dask-yarn","qhub","dask-mpi",]ax=sns.countplot(y=q,data=df2021[q].dropna().str.lower().str.split(", ").explode().to_frame(),order=order);ax.set(ylabel="",title=q);
诊断
我们之前看到,大多数人喜欢使用网页浏览器查看Dask仪表板。
在仪表板中,人们表示最有用的诊断图是
任务流图
进度图,以及
每个工作节点的内存使用图
q="Which Diagnostic plots are most useful?"# New question in 2021
ax=sns.countplot(y=q,data=df2021[q].dropna().str.split(', ').explode().to_frame());ax.set(ylabel="",title=q);
q="Do you use Dask's Performance reports?"# New question in 2021
ax=sns.countplot(y=q,data=df2021[q].explode().to_frame(),order=["Yes","No"]);ax.set(ylabel="",title=q);
q="Do you use Dask's Prometheus Metrics?"# New question in 2021
ax=sns.countplot(y=q,data=df2021[q].explode().to_frame(),order=["Yes","No"]);ax.set(ylabel="",title=q);
q="Is Dask resilient enough for you? (e.g. computations complete)."# new question in 2021
ax=sns.countplot(y=q,data=df2021[q].dropna().explode().to_frame(),order=["Yes","No"]);ax.set(ylabel="",title="Is Dask resilient enough for you?");
q="Is Dask stable enough for you?"ax=sns.countplot(y=q,data=df2021[q].dropna().explode().to_frame(),order=["Yes","No"]);ax.set(ylabel="",title=q);
人们还表示Dask的API对他们来说也足够稳定。
q="Is Dask's API stable enough for you?"ax=sns.countplot(y=q,data=df2021[q].dropna().explode().to_frame(),order=["Yes","No"]);ax.set(ylabel="",title=q);
绝大多数人对当前的发布频率(大约每两周一次)感到满意。
q="How is Dask's release frequency?"# New question in 2021
ax=sns.countplot(y=q,data=df2021[q].dropna().explode().to_frame());ax.set(ylabel="",title=q);
大多数人表示,如果Dask有长期支持版本,他们会将其代码固定在该版本上。
q="If Dask had Long-term support (LTS) releases, would you pin your code to use them?"# New question in 2021
ax=sns.countplot(y=q,data=df2021[q].dropna().explode().to_frame(),order=["Yes","No"]);ax.set(ylabel="",title="Would you pin to a long term support release?");
用户满意度、支持和文档
我们在2021年的调查中问了一系列关于用户满意度的新问题。
Dask有多容易使用?
大多数人认为Dask中等容易使用,与往年调查结果相同。
q="On a scale of 1 - 5 (1 being hardest, 5 being easiest) how easy is Dask to use?"ax=sns.countplot(y=q,data=df2021[q].dropna().explode().to_frame());ax.set(ylabel="1 = Difficult, 5 = Easy",title="How easy is Dask to use?");
Dask的文档如何?
大多数人认为Dask的文档相当不错。
q="How is Dask's documentation?"# New question in 2021
ax=sns.countplot(y=q,data=df2021[q].dropna().explode().to_frame());ax.set(ylabel="1 = Not good, 5 = Great",title=q);
您对GitHub上维护者的响应速度有多满意?
几乎所有回复者都对Dask维护者在GitHub上的响应速度持积极态度。
q="How satisfied are you with maintainer responsiveness on GitHub?"# New question in 2021
ax=sns.countplot(y=q,data=df2021[q].dropna().explode().to_frame());ax.set(ylabel="1 = Not satisfied, 5 = Thrilled",title=q);
q='What Dask resources have you used for support in the last six months?'resource_map={"Tutorial":"Tutorial at tutorial.dask.org","YouTube":"YouTube channel","gitter":"Gitter chat"}df[q]=df[q].str.replace(';',', ')# Make separator values consistent
d=df[q].str.split(', ').explode().replace(resource_map)top=d.value_counts()[:8].indexd=d[d.isin(top)]fig,ax=plt.subplots(figsize=(8,8))ax=sns.countplot(y=q,hue="Year",data=d.reset_index(),ax=ax);ax.set(ylabel="",title=q);
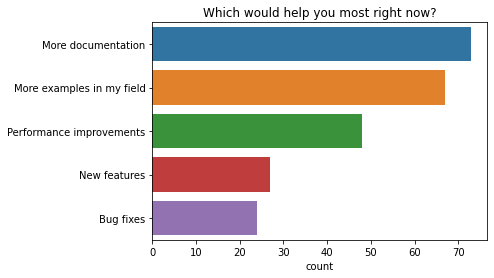
q="Which would help you most right now?"order=["More documentation","More examples in my field","Performance improvements","New features","Bug fixes",]ax=sns.countplot(y=q,data=df2021[q].explode().to_frame(),order=order)ax.set(ylabel="",title=q);
q='What industry do you work in?'data=df2021[df2021["Which would help you most right now?"]=="More examples in my field"]order=data[q].value_counts()[data[q].value_counts()>1].keys()ax=sns.countplot(y=q,data=data[q].dropna().str.split(', ').explode().to_frame(),order=order);ax.set(ylabel="",title="What field do you want more documentation examples for?");
common=(df[df.columns[df.columns.str.startswith("What common feature")]].rename(columns=lambdax:x.lstrip("What common feature requests do you care about most?[").rstrip(r"]")))a=common.loc[2019].apply(pd.value_counts).T.stack().reset_index().rename(columns={'level_0':'Question','level_1':"Importance",0:"count"}).assign(Year=2019)b=common.loc[2020].apply(pd.value_counts).T.stack().reset_index().rename(columns={'level_0':'Question','level_1':"Importance",0:"count"}).assign(Year=2020)c=common.loc[2021].apply(pd.value_counts).T.stack().reset_index().rename(columns={'level_0':'Question','level_1':"Importance",0:"count"}).assign(Year=2021)counts=pd.concat([a,b,c],ignore_index=True)d=common.stack().reset_index().rename(columns={"level_2":"Feature",0:"Importance"})order=["Not relevant for me","Somewhat useful",'Critical to me']sns.catplot(x='Importance',row="Feature",kind="count",col="Year",data=d,sharex=False,order=order);